Running benchmarks
The issue of proper benchmarking is sisyphean, a never ending conversation which reboots as technology and user requirements change. Every benchmark has an agenda of some sort; that is ok provided it does not take the reader for a fool. For these reasons, this section is a work-in-progress by design, which only discusses test cases for which the source code is fully available, which does not require any black-box, so as to allow you to verify and reproduce them fairly easily.
Any comments and other contributions improving this section and/or EVL in general are welcome, please send them to the Xenomai mailing list.
Measuring response time to interrupts
Since the real-time infrastructure has to deliver reliable response times to external events - as in strictly bounded - whatever the system may be running when they happen, we have to measure the latency between the ideal delivery date of such event, and the actual moment the application starts processing it. Then we may assess the jitter as the variation in latency. With Linux running on the hardware, reliable means that an upper bound to such latency can be determined, although we are using a non-formal, probabilistic method through countless hours of testing under a significant stress load. Although the outcome of such test is not by itself representative of the overall capability of a system to support real-time applications, such test going wrong would clearly be a showstopper. No doubt that every real-time infrastructure out there wants to shine on that one. To measure the response time to interrupts in different contexts, EVL provides the latmus utility. The following figure illustrates the potential delays which may exist between the moment an interrupt request is raised by a device, and the time a responder thread running in the application space can act upon it:
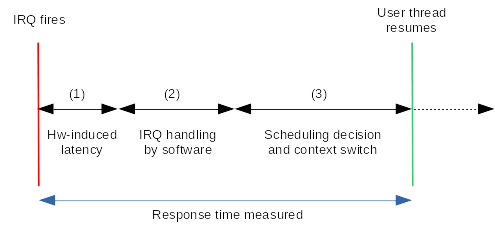
(1) There may be multiple causes for the hardware-induced delay such as (but not limited to):
-
some devices may temporarily block the CPU from completing I/O transactions which may lead to a stall. For instance, some GPUs preventing CPUs to access their I/O memory for a short while, or burst mode DMA affecting the execution rate of instructions in the CPU by keeping it off the memory bus during transfers.
-
the CPU needs to synchronize with the interrupt request internally, the instruction pipeline may be affected by the operations involved in taking an interrupt, leading to additional latency.
-
The time interrupts are masked in the CPU upon request from the software, effectively preventing it to take IRQs.
(2) Although handling the IRQ in some service routine from the real-time core is (hopefully) a short process which ends up readying the responder thread in the scheduler, it may be further delayed:
-
I/D memory caches may have been dirtied by non real-time activities while the real-time system was waiting for the next event. This increases the level of cache misses for both code and data, and therefore slows down the execution of the real-time infrastructure as a whole when it starts handling the incoming event.
-
the time needed to handle a write miss is longer when the write-allocate policy is enabled in the cache controller, making the execution slower when this happens.
(3) Eventually, the scheduler is called in order to reconsider which thread should run on the CPU the responder thread was sleeping on when readied, which is subject to more potential delays:
-
the CPU receiving the IRQ might not be the one the responder sleeps on, in which case the former must send a rescheduling request to the latter, so that it will resume the responder. This is usually done via an inter-processor interrupt, aka IPI. The time required for the IPI to flow to the remote CPU and be handled there further extends the delay. A trivial work around would involve setting the IRQ affinity to the same CPU the responder runs on, but this may not be possible unless the interrupt controller does allow this on your SoC.
-
once the scheduler code has determined that the responder thread should resume execution, the context switch code is performed to restore the memory context and the register file for that thread to resume where it left off. Switching memory context may be a lenghty operation on some architectures as this affects the caches and requires strong synchronization.
-
the hardware-induced slowdowns mentioned for step (2) apply as well.
Info
Getting into these issues is not a matter of following a dual kernel vs native preemption approach: all of them bite the same way regardless.
Measuring response time to timer events
A real-time system normally comes with a way to measure the latency of
its threads on timer events. Xenomai
3 provides
one, the PREEMPT_RT
project as well, so does EVL with the latmus program. No wonder why,
running precisely timed work loops is a basic requirement for
real-time applications. Besides, such a test requires only little
preparation: we don’t need any external event source for running it,
no specific equipment is needed, the on-chip high-precision clock
timer of the system under test should be sufficient, therefore we can
measure easily the latency directly from there.
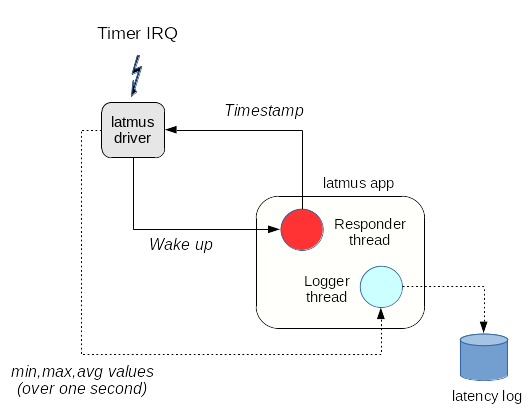
[Xenomai 4] implements this test with the help of the latmus driver which sends a wake up event to an EVL-enabled responder thread created by the latmus program each time a new timer interrupt occurs. The responder thread gets a timestamp from EVL’s monotonic clock immediately when it resumes upon wake up, then sends that information to the driver, which in turn calculates the latency value, i.e. the delay between the ideal time the interrupt should have been received and the actual wake up time reported by the responder thread. This way, we account for all of the delays mentioned earlier which might affect the accuracy of a request for a timed wake up.
The driver accumulates these results, sending an intermediate summary
every second to a logger thread with the minimum, maximum and average
latency values observed over this period. The 1Hz display loop which
is visible while latmus is running is synchronized on the receipt of
such summary. The following figure illustrates this execution flow:
When the test completes, latmus determines the minimum, worst case
and average latency values over the whole test duration. Upon request
by passing the -g option, latmus dumps an histogram showing the
frequency distribution of the worst case figures which have been
observed over time. The output format can be parsed by
gnuplot.
Running the timer-based test
First, we need the latmus driver to be loaded into the kernel on the
SUT. Therefore CONFIG_EVL_LATMUS must be enabled in the kernel
configuration. From the command line, the entire test is controlled by
latmus using the -m option, which can be omitted since measuring
the response time to timer events is the default test.
Measuring response time to timer events
# latmus
RTT|  00:00:01  (user, 1000 us period, priority 98, CPU1)
RTH|----lat min|----lat avg|----lat max|-overrun|---msw|---lat best|--lat worst
RTD|      1.211|      1.325|      2.476|       0|     0|      1.211|      2.476
RTD|      1.182|      1.302|      3.899|       0|     0|      1.182|      3.899
RTD|      1.189|      1.314|      2.486|       0|     0|      1.182|      3.899
RTD|      1.201|      1.315|      2.510|       0|     0|      1.182|      3.899
RTD|      1.192|      1.329|      2.457|       0|     0|      1.182|      3.899
RTD|      1.183|      1.307|      2.418|       0|     0|      1.182|      3.899
RTD|      1.206|      1.318|      2.375|       0|     0|      1.182|      3.899
RTD|      1.206|      1.316|      2.418|       0|     0|      1.182|      3.899
^C
---|-----------|-----------|-----------|--------|------|-------------------------
RTS|      1.182|      1.316|      3.899|       0|     0|    00:00:08/00:00:08
Collecting plottable histogram data (timer test)
RTT|  00:00:01  (user, 1000 us period, priority 98, CPU1)
RTH|----lat min|----lat avg|----lat max|-overrun|---msw|---lat best|--lat worst
RTD|      1.156|      1.273|      1.786|       0|     0|      1.156|      1.786
RTD|      1.170|      1.288|      4.188|       0|     0|      1.156|      4.188
RTD|      1.135|      1.253|      3.175|       0|     0|      1.135|      4.188
RTD|      1.158|      1.275|      2.974|       0|     0|      1.135|      4.188
...
^C
# test started on: Fri Jan 24 15:36:34 2020
# Linux version 5.5.0-rc7+ (rpm@cobalt) (gcc version 9.2.1 20190827 (Red Hat 9.2.1-1) (GCC)) #45 SMP PREEMPT IRQPIPE Wed Jan 22 12:24:03 CET 2020
# BOOT_IMAGE=(tftp)/tqmxe39/switch/bzImage rw ip=dhcp root=/dev/nfs nfsroot=192.168.3.1:/var/lab/tftpboot/tqmxe39/switch/rootfs,tcp,nfsvers=3 nmi_watchdog=0 console=ttyS0,115200 isolcpus=1 evl.oobcpus=1
# libevl version: evl.0 -- #a3ceb80 (2020-01-22 11:57:11 +0100)
# sampling period: 1000 microseconds
# clock gravity: 2000i 3500k 3500u
# clocksource: tsc
# vDSO access: architected
# context: user
# thread priority: 98
# thread affinity: CPU1
# C-state restricted
# duration (hhmmss): 00:01:12
# peak (hhmmss): 00:00:47
# min latency: 0.205
# avg latency: 3.097
# max latency: 25.510
# sample count: 71598
0 95
1 25561
2 18747
3 2677
4 6592
5 17056
6 664
7 48
8 18
9 12
10 18
11 24
12 14
13 2
14 6
15 5
16 5
17 6
18 23
19 17
20 3
21 1
22 1
23 1
24 1
25 1
The output format starts with a comment section which gives specifics
about the test environment and the overall results (all lines from
this section begin with a hash sign). The comment section is followed
by the frequency distribution forming the histogram, in the form of a
series of value pairs: <latency-µs>
Interpreting the comment section of a data distribution
-
# test started on: Fri Jan 24 15:36:34 2020
Date the test was started (no kidding).
-
# Linux version 5.5.0-rc7+ (rpm@cobalt) (gcc version 9.2.1 20190827 (Red Hat 9.2.1-1) (GCC)) #45 SMP PREEMPT IRQPIPE Wed Jan 22 12:24:03 CET 2020
The output of uname -a on the system under test.
-
# BOOT_IMAGE=(tftp)/tqmxe39/switch/bzImage rw ip=dhcp root=/dev/nfs nfsroot=192.168.3.1:/var/lab/tftpboot/tqmxe39/switch/rootfs,tcp,nfsvers=3 nmi_watchdog=0 console=ttyS0,115200 isolcpus=1 evl.oob_cpus=1
The kernel command line as returned by /proc/cmdline.
-
# libevl version: evl.0 – #a3ceb80 (2020-01-22 11:57:11 +0100)
The version information extracted from libevl including its major version number, and optionally the GIT commit hash and date thereof libevl was built from.
-
# sampling period: 1000 microseconds
The frequency of the event to be responded to by the system under test, which can either be a timer tick or a GPIO signal.
-
# clock gravity: 2000i 3500k 3500u
The calibration settings of the EVL core clock which applied during the test.
-
# clocksource: tsc
The name of the kernel clock source used by the EVL core for reading timestamps. This value depends on the processor architecture, tsc commonly refers to x86.
-
# vDSO access: architected
Since kernel v5.5, the core reports the type of access the EVL applications have to the clock source via the vDSO. The following values are defined:
-
architected denotes a fast (syscall-less) vDSO access to a built-in clock source defined by the architecture itself. This is the best case.
-
mmio denotes a fast (syscall-less) vDSO access to a [clock source] (/dovetail/porting/clocksource/#generic-clocksource-vdso) exported via Dovetail’s generic access to MMIO-based devices. This is the second best case.
-
none denotes a not-so-fast access to the kernel clock source without vDSO support, which is one of the possible issues with legacy x86 hardware. You could also have such value due to an incomplete port of Dovetail to your target system, which may be missing the conversion of existing MMIO clock source to a user-mappable one visible from the generic vDSO mechanism.
-
-
# context: user
Which was the context of the responder, among:
-
user for EVL threads running in user-space waiting for timer events,
-
kernel for EVL kernel threads waiting for timer events,
-
irq for EVL interrupt handlers receiving timer events,
-
oob-gpio for EVL threads running in user-space waiting for GPIO events,
-
inband-gpio for regular (non-EVL) threads running in user-space waiting for GPIO events.
-
-
# thread priority: 98
The priority of the responder thread in the out-of-band SCHED_FIFO class. By definition, any legit value starting from 1 and on gives the responder thread higher priority than any in-band task running in the system, including kernel threads of any sort.
-
# thread affinity: CPU1
The processor affinity of the responder thread. If the CPU id. is suffixed by -noisol, then the responder was not running on an isolated processor during the test, which most likely entailed higher latency values compared to isolating this CPU - unless you did not stress the SUT enough or at all while measuring, which would make the figures obtained quite flawed and probably worthless anyway.
-
# C-state restricted
Whether the processor C-State was restricted to the shallowest level, preventing it to enter deeper sleep states which are known to induce extra latency.
-
# duration (hhmmss): 00:01:12
How long the test ran (according to the wall clock).
-
# peak (hhmmss): 00:00:47
When the worst case value was observed, relatively to the beginning of the test.
-
# min latency: 0.205
The best/shortest latency value observed throughout the test.
-
# avg latency: 3.097
The average latency value observed, accounting for all measurement samples collected during the test.
-
# max latency: 25.510
The maximum value observed throughout the test. This is the worst case value we should definitely care about, provided the stress load and test duration are meaningful.
-
# sample count: 71598
The number of samples collected. The larger, the better (71598 samples in this example is obviously way too small for drawing any meaningful conclusion). Running a test for a period of 24 hours under significant stress load is common practice to get reliable results.
Measuring response time to GPIO events
In addition to timer events, you will likely need to get a sense of the worst case response time to common device interrupts you may expect from EVL. Since you want the common programming model to be available for developing real-time applications, the responder has to be a thread running in user space. This test mode is also available from the latmus program, when paired with a Zephyr-based application which monitors the response time from a remote system to the GPIO events it sends.
Warning
From the perspective of the monitor system, we will measure the time it takes the SUT to not only receive the incoming event, but also to respond to it by sending a converse GPIO acknowledge. Therefore we expect the worst case figures to be higher than those reported by a plain timer test which only gets a timestamp on wake up.
For implementing this test, we need:
-
a small development board which supports the Zephyr RTOS, and offers external GPIO pins. This GPIO test was originally developed on a FRDM-K64F board, a low-cost development platform from NXP.
-
the latency monitoring application from the Zephyr project, aka latmon, which runs on the FRDM-K64F board. This Zephyr application periodically sends a pulse on one GPIO (output) line to be received by the system under test, then waits for an acknowledge on another GPIO (input) line, measuring the time elapsed between the two events.
-
the EVL-based system under test, also offering external GPIO pins. This system runs
latmuswhich runs a responder loop listening to GPIO events sent by thelatmonlatency monitor on the Zephyr board, using two separate GPIO lines. The period is chosen with the-poption (which defaults to 1 ms, i.e. 1 Khz sampling loop) when startinglatmus. This test settings are passed bylatmustolatmonduring the setup phase via UDP. -
a couple of wires between the GPIO pins of system under test and those of the Zephyr board running
latmonfor triggering pulses to and receiving acknowledges from the system under test. -
a network connection between both systems so that
latmusandlatmoncan communicate via UDP.
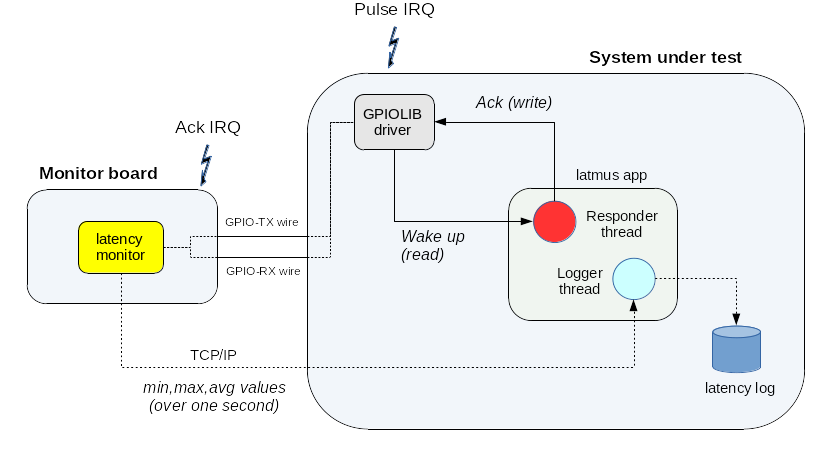
latmon periodically raises a GPIO pulse event on the TX wire, which
causes the SUT to receive an interrupt. By calling into the
EVL-enabled
gpiolib
driver, the responder thread created by latmus waits for
such interrupt by monitoring edges on the GPIO pulse signal. Upon
receipt, it immediately acknowledges the event by raising an edge on
the GPIO ack signal, which latmon monitors for calculating the
latency value as the delay between the acknowledge and pulse
events. The latter accumulates these results, sending an intermediate
summary every second over UDP to a logger thread running on the remote
latmus peer.
This summary includes the minimum, maximum and average
latency values observed over the last 1Hz period. The 1Hz display loop
you can observe while latmus runs is synchronized on the receipt of
such summary. The following figure illustrates this execution flow:
Quick recipe: monitoring a Raspberry PI board with the FRDM-K64F
This recipe works with any Raspberry PI board featuring a 40-pin GPIO header. It has been successfully used for monitoring the response time to GPIO events from models 2B, 3B and 4B.
-
Build and install EVL on your Raspberry PI as described in this document.
-
Install the Zephyr SDK on your development system. Once the SDK is installed, if your are using Zephyr for the first time, you may want to get your feet wet with the blinky example. The rest of the description assumes that the Zephyr SDK is rooted at ~/zephyrproject, and the libevl source tree was cloned into ~/libevl.
-
Connect the GPIO lines between both boards:
-
GPIO24 on the FRDM-K64F (pulse signal) should be wired to GPIO23 on the RPI3 (ack signal, BCM numbering).
-
GPIO25 on the FRDM-K64F (ack signal) should be wired to GPIO24 on the RPI3 (pulse signal, BCM numbering).
-
-
An OpenSDA J-Link Onboard Debug Probe is present on the FRDM-K64F, which can be used to flash the board. On your development system, the OpenOCD suite provides GDB remote debugging and flash programming support compatible with this probe over USB. In most cases, a binary OpenOCD package should be readily available from your favorite Linux distribution. Once the OpenOCD suite is installed, you may need to add some udev rules in order for the USB device to appear on your development system, such as these ones.
-
Connect a USB cable from the Open SDA micro-USB connector of the FRDM-K64F to your development system. This will power on the FRDM-K64F board, enabling firmware upload.
-
Flash the Zephyr RTOS image with
latmonenabled into the FRDM-K64F.
Once booted, the latency monitor is taking over the Zephyr board. You should see the following output in the serial console of the FRDM-K64F:
*** Booting Zephyr OS build zephyr-<some version information> ***

[00:00:00.006,000] <inf> latency_monitor: DHCPv4 binding...
[00:00:03.001,000] <inf> eth_mcux: Enabled 100M full-duplex mode.
[00:00:03.003,000] <inf> net_dhcpv4: Received: <IP address of the FRDM-K64F>
[00:00:03.003,000] <inf> latency_monitor: DHCPv4 ok, listening on <IP>:2306
[00:00:03.003,000] <inf> latency_monitor: waiting for connection...
From that point, latmon running on the FRDM-K64F is ready to accept
incoming connections from latmus running on the Raspberry PI (SUT).
Native preemption and IRQ threading
The GPIO response time of the standard or PREEMPT_RT kernel may be delayed by threading the GPIO interrupt the latmus application monitors, since this behavior is built in the generic GPIOLIB driver, and forced by PREEMPT_RT for most interrupts anyway. The overhead involved in waiting for a context switch to be performed to the threaded handler increases the latency under stress load. Disabling IRQ threading entirely in a single kernel configuration (i.e. without EVL) would be the wrong option though, making the latency figures generally really bad. However, you can raise the priority of the IRQ thread serving the latency pulse above any activity which should not be in its way, so that it is not delayed even further.
In order to do this, you first need to locate the IRQ thread which
handles the GPIO pulse interrupts. A simple way to achieve this is to
check the output of /proc/interrupts once the test runs, looking for
the GPIO consumer called latmon-pulse. For instance, the following
output was obtained from a PREEMPT_RT kernel running on an i.MX8M SoM:
~ # cat /proc/interrupts
           CPU0       CPU1       CPU2       CPU3
  3:     237357      90193     227077     224949     GICv3  30 Level     arch_timer
  6:          0          0          0          0     GICv3  79 Level     timer@306a0000
  7:          0          0          0          0     GICv3  23 Level     arm-pmu
  8:          0          0          0          0     GICv3 128 Level     sai
  9:          0          0          0          0     GICv3  82 Level     sai
 20:          0          0          0          0     GICv3 110 Level     30280000.watchdog
 21:          0          0          0          0     GICv3 135 Level     sdma
 22:          0          0          0          0     GICv3  66 Level     sdma
...
 52:    1355491          0          0          0  gpio-mxc  12 Edge      latmon-pulse   <<< The one we look for
 55:          0          0          0          0  gpio-mxc  15 Edge      ds1337
 80:          0          0          0          0  gpio-mxc   8 Edge      bd718xx-irq
 84:          0          0          0          0  gpio-mxc  12 Edge      30b50000.mmc cd
...
With this information, we can now figure out which IRQ thread is handling the pulse events monitored by latmus, raising its priority as needed. By default, all IRQ threads are normally set to priority 50 in the SCHED_FIFO class. Typically, you may want to raise the priority of this particular IRQ handler so that it does not have to compete with other handlers. For instance, continuing the previous example we would raise the priority of the kernel thread handling IRQ52 to 99:
Tip
You can refine even futher the runtime configuration of a kernel threading its interrupts by locking the SMP affinity of the device IRQ threads on particular CPUs, in order to either optimize the wake up time of processes waiting for such events, or reduce the jitter in processing the real-time workload. Whether you should move an IRQ thread to the isolated CPU also running the real-time workload in order to favour locality, or keeping them spatially separate in order to reduce the disturbance of interrupt handling on the workload is something you may have to determine on a case-by-case basis.
~ # pgrep irq/52
345
~ # chrt -f -p 99 345
pid 345's current scheduling policy: SCHED_FIFO
pid 345's current scheduling priority: 50
pid 345's new scheduling policy: SCHED_FIFO
pid 345's new scheduling priority: 99
Which can be shortened as:
~ # chrt -f -p 99 $(pgrep irq/52)
pid 345's current scheduling policy: SCHED_FIFO
pid 345's current scheduling priority: 50
pid 345's new scheduling policy: SCHED_FIFO
pid 345's new scheduling priority: 99
Warning
In a single kernel configuration, the IRQ thread process varies
between runs of the latmusprogram for the GPIO test, because the
interrupt descriptor is released at the end of each execution by
GPIOLIB. Make sure to apply the procedure explained above each time
you spawn a new test.
Running the GPIO-based test
Once the Zephyr board is started with the latmon application flashed in, we can run the benchmark tests on the system under test.
This is done by running the latmus program on the SUT, passing
either of the -Z or -z option switch to select the execution
stage,
depending on whether we look for out-of-band response time figures
(i.e. using EVL) or plain in-band response time figures
(i.e. without relying on EVL’s real-time capabilities)
respectively. In the latter case, we would not even need EVL to be
present in the kernel of the SUT; typically we would use a
PREEMPT_RT
kernel instead.
Regardless of the execution stage they should run on, both tests are
configured the same way. On the latmus command line, we need to
specify which GPIO chip and pin number should be used for receiving
GPIO events (-I <gpiochip-name>,<pin-number>) and sending
acknowledge signals (-O <gpiochip-name>,<pin-number>).
When the test is started on the SUT, the
latmon
application should start monitoring the GPIO response times of
latmus indefinitely until the latter stops, at which point the
latency monitor goes back waiting for another connection.
[00:04:15.651,000] <inf> latency_monitor: monitoring started
/* ...remote latmus runs for some time... */
[00:04:24.877,000] <inf> latency_monitor: monitoring stopped
[00:04:24.879,000] <inf> latency_monitor: waiting for connection...
Measuring out-of-band response time to GPIO events (on the SUT)
/*
 * Caution: the following output was produced by running the test only
 * a few seconds on an idle EVL-enabled system: the results displayed do not
 * reflect the worst case latency (which is higher) on this platform when
 * the test runs long enough under proper stress load.
 */
# latmus -Z zephyr -I gpiochip0,23 -O gpiochip0,24
connecting to latmon at 192.168.3.60:2306...
RTT|  00:00:02  (oob-gpio, 1000 us period, priority 98, CPU1)
RTH|----lat min|----lat avg|----lat max|-overrun|---msw|---lat best|--lat worst
RTD|     11.541|     15.627|     18.125|       0|     0|     11.541|     18.125
RTD|     10.916|     15.617|     30.950|       0|     0|     10.916|     30.950
RTD|     12.500|     15.598|     25.908|       0|     0|     10.916|     30.950
RTD|      1.791|     15.571|     25.908|       0|     0|      1.791|     30.950
RTD|     13.958|     15.647|     26.075|       0|     0|      1.791|     30.950
^C
---|-----------|-----------|-----------|--------|------|-------------------------
RTS|      1.791|     15.606|     30.950|       0|     0|    00:00:05/00:00:05
Measuring in-band response time to GPIO events (on the SUT)
/*
 * Caution: the following output was produced by running the test only
 * a few seconds on an idle PREEMPT_RT-enabled system: the results displayed do
 * not reflect the worst case latency (which is higher) on this platform when
 * the test runs long enough under proper stress load.
 */
# latmus -z zephyr -I gpiochip0,23 -O gpiochip0,24
connecting to latmon at 192.168.3.60:2306...
CAUTION: measuring in-band response time (no EVL there)
RTT|  00:00:02  (inband-gpio, 1000 us period, priority 98, CPU1)
RTH|----lat min|----lat avg|----lat max|-overrun|---msw|---lat best|--lat worst
RTD|     38.075|     52.401|     93.733|       0|     0|     38.075|     93.733
RTD|     39.700|     53.289|     91.608|       0|     0|     38.075|     93.733
RTD|     41.283|     54.914|     93.900|       0|     0|     38.075|     93.900
RTD|     38.075|     54.615|     91.608|       0|     0|     38.075|     93.900
RTD|     38.075|     54.767|     96.108|       0|     0|     38.075|     96.108
RTD|     41.283|     54.563|     91.608|       0|     0|     38.075|     96.108
^C
---|-----------|-----------|-----------|--------|------|-------------------------
RTS|     38.075|     54.037|     96.108|       0|     0|    00:00:07/00:00:07
Configuring the test kernel for benchmarking
Hints for configuring any test kernel
-
turn off all debug features and tracers in the kernel configuration.
-
ensure all CPUs keep running at maximum frequency by enabling the “performance” CPU_FREQ governor, or disabling CPU_FREQ entirely.
-
have a look at the caveats here.
-
make sure the GPU driver does not cause ugly latency peaks.
-
isolate a CPU for running the latency test. For instance, you could reserve CPU1 for this purpose, by passing isolcpus=1 on the kernel command line at boot.
-
verify your kernel configuration either offline or online using the evl check command.
Specific hints to configure a native preemption kernel
-
enable maximum preemption (
CONFIG_PREEMPT_RT_FULLif available). -
The GPIO response test over PREEMPT_RT involves a threaded interrupt handler for processing GPIO events. This interrupt thread must have higher scheduling priority than other interrupt threads. See this illustration for more.
-
check that no common thread can compete with the responder thread on the same priority level. Some kernel housekeeping threads might, but regular threads should not. For latency measurement, setting the scheduling parameters of the responder thread to [SCHED_FIFO, 98] is recommended. Setting the responder to priority 99 would work for this purpose as well (with no observable gain actually), however it is not recommended to allow real-world application threads to compete with threaded IRQ handlers and other critical housekeeping tasks running in kernel space, since the latter might assume that no user code may preempt in tricky corner cases.
-
switch to a non-serial terminal (ssh, telnet). Although this problem is being worked on upstream, significant output to a serial device might affect the worst case latency on some platforms with native preemption because of the implementation issues in console drivers, so the console should be kept quiet. You could also add the “quiet” option to the kernel boot arguments as an additional precaution.
Specific hints to configure an EVL-enabled kernel
-
turn on CONFIG_EVL in the configuration.
-
turn off all features from the CONFIG_EVL_DEBUG section. The cost of leaving the watchdog enabled should be marginal on the latency figures though.
-
if you plan to measure the response time to GPIO interrupts, you will need
CONFIG_GPIOLIBandCONFIG_GPIOLIB_OOBto be enabled in the kernel configuration. You will also need to enable the GPIO pin control driver for your hardware platform, which must be GPIOLIB-compliant (most are these days), and out-of-band capable.
The issue of proper stress load
Finding the worst case latency in measuring the response time to interrupts requires applying a significant stress load to the system in parallel to running the test itself. There have been many discussions about what significant should mean in this context. Some have argued that real-time applications should have reasonable requirements, defined by a set of restrictions on their behavior and environment, so that bounded response time can be guaranteed, which sounds like asking application developers to abide by the rules defined by kernel folks. When was the last time any of them did so anyway?
Obviously, we cannot ask the infrastructure to be resilient to any type of issue, including broken hardware or fatal kernel bugs. Likewise, it is ok to define and restrict which API should be used by applications to meet their real-time requirements. For instance, there would be no point in expecting low and bounded latency from all flavours of clone(2) calls, or whenever talking to some device involves a slow bus interface like i2c. Likewise, we may impose some restrictions on the kernel when it deals with these applications, like disabling ondemand loading and copy-on-write mechanisms with mlock(2).
Per Murphy’s laws, we do know that there is no point in wishful thinking, like hoping for issues to never happen provided that we always do reasonable things which would meet some hypothetical standard of the industry. Application developers do not always do reasonable things, they just do what they think is best doing, which almost invariably differs from what kernel folks want or initially envisioned. After all, the whole point of using Linux in this field is the ability to combine real-time processing with the extremely rich GPOS feature set such system provides, so there is no shortage of options and varieties. Therefore, when it comes to testing a real-time infrastructure, let’s tickle the dragon’s tail.
There are many ways to stress a system, often depending on which kind of issues we would like to trigger, and what follows does not pretend to exhaustiveness. This said, these few aspects have proved to be relevant over time when it comes to observing the worst case latency:
-
Each time the kernel needs to switch between tasks which belong to distinct user address spaces, some MMU operations have to be performed in order to change the active memory context, which might also include costly cache maintenance in some cases. Those operations tend to take longer when the cache and memory subsystems have been under pressure at the time of the switch. Because the context switching process runs with interrupts disabled in the CPU, the higher the task switch rate, the more likely such extended interrupt masking may delay the response time to an external event.
-
How the response time of the real-time infrastructure is affected by unfavourable cache situations is important. While no real-time work is pending, the real-time infrastructure just sleeps until the next event to be processed arrives. In the meantime, GPOS (as in non-realtime) activities may jump in, mobilizing all the available hardware resources for carrying out their work. As they do this, possibly treading on a lot of code and manipulating large volumes of data, the real-time program is gradually evicted from the CPU caches. When it resumes eventually in order to process an incoming event, it faces many cache misses, which induce delays. For this reason, and maybe counter-intuitively at first, the faster the timed loop the responder thread undergoes, the fewer the opportunities for the GPOS work to disturb the environment, the better the latency figures (up to a certain rate of course). On the contrary, a slower loop increases the likeliness of cache evictions when the kernel runs GPOS tasks while the real-time system is sleeping, waiting for the next event. If the CPU caches have been disturbed enough by the GPOS activities from the standpoint of the real-time work, then you may get closer to the actual worst case latency figures.
In this respect, the - apparently - dull dd(1) utility may become your worst nightmare as a real-time developer if you actually plan to assess the worst-case latency with your system. For instance, you may want to run this stupid workload in parallel to your favourite latency benchmark (hint: CPU isolation for the real-time workload won’t save the day on most platforms):
$ dd if=/dev/zero of=/dev/null bs=128M &Warning
Using a block factor of 128M is to make sure the loop will be disturbing the CPU caches enough. Too small a value here would only create a mild load, barely noticeable in the latency figures on many platforms.
-
A real-time application system is unlikely to be only composed of a single time-critical responder thread. We may have more real-time threads involved, likely at a lower priority though. So we need to assess the ability of the real-time infrastructure to schedule all of these threads efficiently. In this case, we want the responder thread to compete with other real-time threads for traversing the scheduler core across multiple CPUs in parallel. Efficient serialization of these threads within a CPU and between CPUs is key.
-
Since we have to follow a probabilistic approach for determining the worst case latency, we ought to run the test long enough in order to increase the likeliness of exercizing the code path(s) which might cause the worst latency. Practically, running the test under load for 24 hours uninterrupted may deliver a worst case value we can trust.
Defining the stress workloads
A WORD OF CAUTION: several stress workloads mentioned in this section are likely to ignite the CPUs of your test machine(s) quite badly. Before any attempt is made at running any stress workload, you do have to check for potential thermal issues with your hardware first. Typically, the Raspberry PI 4B was known to suffer from overheating until a firmware revision greatly improved the situation.
Using Linux for running real-time workloads means that we have to meet contradictory requirements on a shared hardware, maximum throughtput and guaranteed response time at the same time, which on the face of it looks pretty insane, therefore interesting. Whichever real-time infrastructure we consider, we have to assess how badly non real-time applications might hurt the performances of real-time ones. With this information, we can decide which is best for supporting a particular real-time application on a particular hardware. To this end, the following stress workloads are applied when running benchmarks:
-
As its name suggests, the Idler workload is no workload at all. Under such conditions, the response time of the real-time system to some event (i.e. timer or GPIO interrupt) is measured while the GPOS is doing nothing in particular except waiting for something to do. The purpose is to get a sense of the best case we might achieve with a particular hardware and software configuration, unimpeded by GPOS activities.
-
The Scary Grinder workload combines hackbench loops to a continuous dd(1) copy from
/dev/zeroto/dev/nullwith a large block size (128Mb). This workload most often causes the worst latency spots on a platform for any type of real-time infrastructure, dual kernel and native preemption (PREEMPT_RT). As it pounds the CPU caches quite badly, it reveals the inertia of the real-time infrastructure when it has to ramp up quickly from an idle state in order to handle an external event. The more complex the code code paths involved in doing so, the longer the response time. Do not expect ugly figures on Big Irons and other high-end x86 though, however this workload is likely to thrash common embedded systems. The shell commands to start this workload are:~ # while :; do hackbench; done & ~ # dd if=/dev/zero of=/dev/null bs=128M & -
The Pesky Neighbour workload is based on the stress-ng test suite. Several “stressors” imposing specific loads on various kernel subsystems are run sequentially. The goal is to assess how sensitive the real-time infrastructure is to the pressure non real-time applications might put on the system by using common kernel interfaces. Given the ability some
stress-ngstressors have to thrash and even break the system, we limit the amount of damage they can do with specific settings, so that the machine stays responsive throughout long-running tests. With this workload, we generally focus on stressors which affect the scheduler and the memory subsystem.
Common set up rules for all benchmarks
-
The kernel configuration is double-checked for features which may have an adverse impact on the latency figures. Typically, for benchmarking purpose only, all debug options are turned off for both types of real-time infrastructures, dual kernel like EVL or native preemption (PREEMPT_RT). evl check can be used to verify a kernel configuration.
-
On a multi-core system, we always reserve CPU1 for running the test code which is monitored for response time, since native preemption requires some CPU(s) to be dedicated to the real-time workload for best results. This implies that
isolcpus=1 evl.oobcpus=1are passed to the kernel as boot options. Withstress-ng, we also restrict the CPUs usable for running the stress load using the--tasksetoption. Assuming CPU1 is the only isolated CPU running a test, this shell expression should produce the correct CPU set for that option:0,2-$(nproc). -
Some limits should be put on what the stress workload is allowed to do, in order to avoid bringing the machine down to a complete stall, or triggering OOM situations which may have unwanted outcomes such as wrecking the test (or even the machine) entirely. Since we are not in the business of crash testing, we need to set these limits depending on the compute power of the test hardware.
-
All threads running some stress workload should belong to the SCHED_OTHER scheduling class. They should NOT compete with the real-time threads whose response time is being monitored during the test. Although this would have actually no impact on the real-time performances of a dual kernel system, this would lead to an unfair comparison with a native preemption system such as PREEMPT_RT which is sensitive to this issue by design. For instance, we ensure this with
stress-ngby excluding all stressors implicitly involving theSCHED_FIFOorSCHED_RRpolicies, setting the--schedparameter tootherfor good measure.
PREEMPT_RT specific tweaks for benchmarking
-
With native preemption, if a particular test involves responding to a device interrupt such as the GPIO response test served by a threaded handler, we make sure to raise the task priority of such handler above all others. This rule does not apply to a dual kernel infrastructure like EVL, which always processes IRQ events immediately from the interrupt context.
-
on x86, PREEMPT_RT v5.6.10-rt5 may trigger a BUG() assertion then crash as a result of
stress-nginjecting a memory error via the madvise(2) interface ifCONFIG_MEMORY_FAILUREis enabled in the kernel configuration. This is typically something the Pesky workload we apply while monitoring latency would do, so you need to disableCONFIG_MEMORY_FAILUREto prevent this.
The benchmark scenarios
We want to characterize the following aspects of a real-time infrastructure:
-
its response time to external interrupts in the worst (observed) case when the GPOS side of the system is under stress. From this information we should be able to get a clear picture of the typical applications such infrastructure can best support, in terms of low latency and jitter requirements. We will be using the following test programs to do so, for measuring the response time to timer and GPIO events respectively:
-
for EVL, the latmus program in timer response mode and GPIO response mode.
-
for PREEMPT_RT, the cyclictest program, and the latmus program in GPIO response mode which can run without EVL support.
-
-
the overhead it adds to the GPOS side as a result of running the in-kernel real-time machinery. Because we aim at sharing a single hardware between GPOS and RTOS activities, we need hints about the actual cost of running the real-time infrastructure on the overall system. In many cases, especially in the embedded space, the ability to downsize the compute power required for running mixed applications is valuable. There is no test program ready for this part yet. Any thought about the way to best do this, contribution of any sort is welcome.
